Transformers (deep learning models) are better at predicting the tail distribution
This article is based on one of my working papers.
In a setting where we predict PEAD with earnings call transcripts, I found
deep learning models perform better than traditional regression and earnings-surprise models
more importantly, the performance lead is most significant on extreme data points (i.e., the tails of the distribution)
“For example, when we ask the four models to predict the full sample, the performance lead of Transformer against SUE is about 3.5% (3.94%-0.44%). However, if we only predict the top and bottom 10% of CAR(0,21) (i.e., the tails of the distribution), Transformer’s performance lead jumps to 8.19% (9.05%-0.86%).”
1 Problem setting and data
PEAD (post-earnings-announcement drift) is the observation that stock prices drift upward if there are good surprises in the earnings announcement, and drift downward on bad surprises. I use CAR(0,21)—the cumulative abnormal return in the first 21 trading days (roughly one month)—to operationalize PEAD. I use earnings call transcripts and several financial ratios to predict PEAD: $$ CAR(0,21) = f(\text{transcript}, X) $$ where $X$ is a collection of financial ratios, including but not limited to market cap, volatility, previous CAR (e.g., CAR(-21, -3)), earnings surprises, and number of analyst forecasts. $f$ is the prediction model. We compare the performance of the following four models:
- Hierarchical Transformer: Sentences are first encoded into embeddings with a Transformer (Vaswani et al., 2017), and then the sentence embeddings are encoded into a document-level embedding with another Transformer. The architecture is similar to (Yang et al., 2020).
- Hierarchical LSTM: Similar to the Hierarchical Transformer, but I replace the Transformer encoders with an LSTM encoder. The architecture is similar to (Yang et al., 2023).
- OLS. The classic linear regression model. Note that I didn’t include transcript text as an input since OLS struggles with text.
- SUE. The “Standard Unexpected Earnings” model. In this model, the only predictors are earnings surprise, operationalized as the actual earnings minus the average analyst forecasts.
- Hierarchical Transformer and LSTM are deep learning (deep neural network) models. LSTM was the most popular NLP architecture before 2018. The Transformer was proposed in 2017 and quickly overtook LSTM as the go-to architecture in today’s NLP models. It’s the building block of large language models like ChatGPT.
- OLS and SUE are more traditional and frequently seen in academic papers (especially in finance).
I collect all earnings calls for S&P 500 stocks during 2008–2010. To minimize the impact of outlier years, each model is trained and evaluated in a rolling window (Meursault et al., 2021). Each window consists of two years of training data and one quarter of test data. Specifically, in the first window, we use 2008Q1–2009Q4 for training and test on 2010Q1; in the second window, we train on 2008Q2–2010Q1 and test on 2010Q2, etc. There are 48 testing periods in total, ranging from 2010Q1 to 2021Q4.
2 The goal of our test
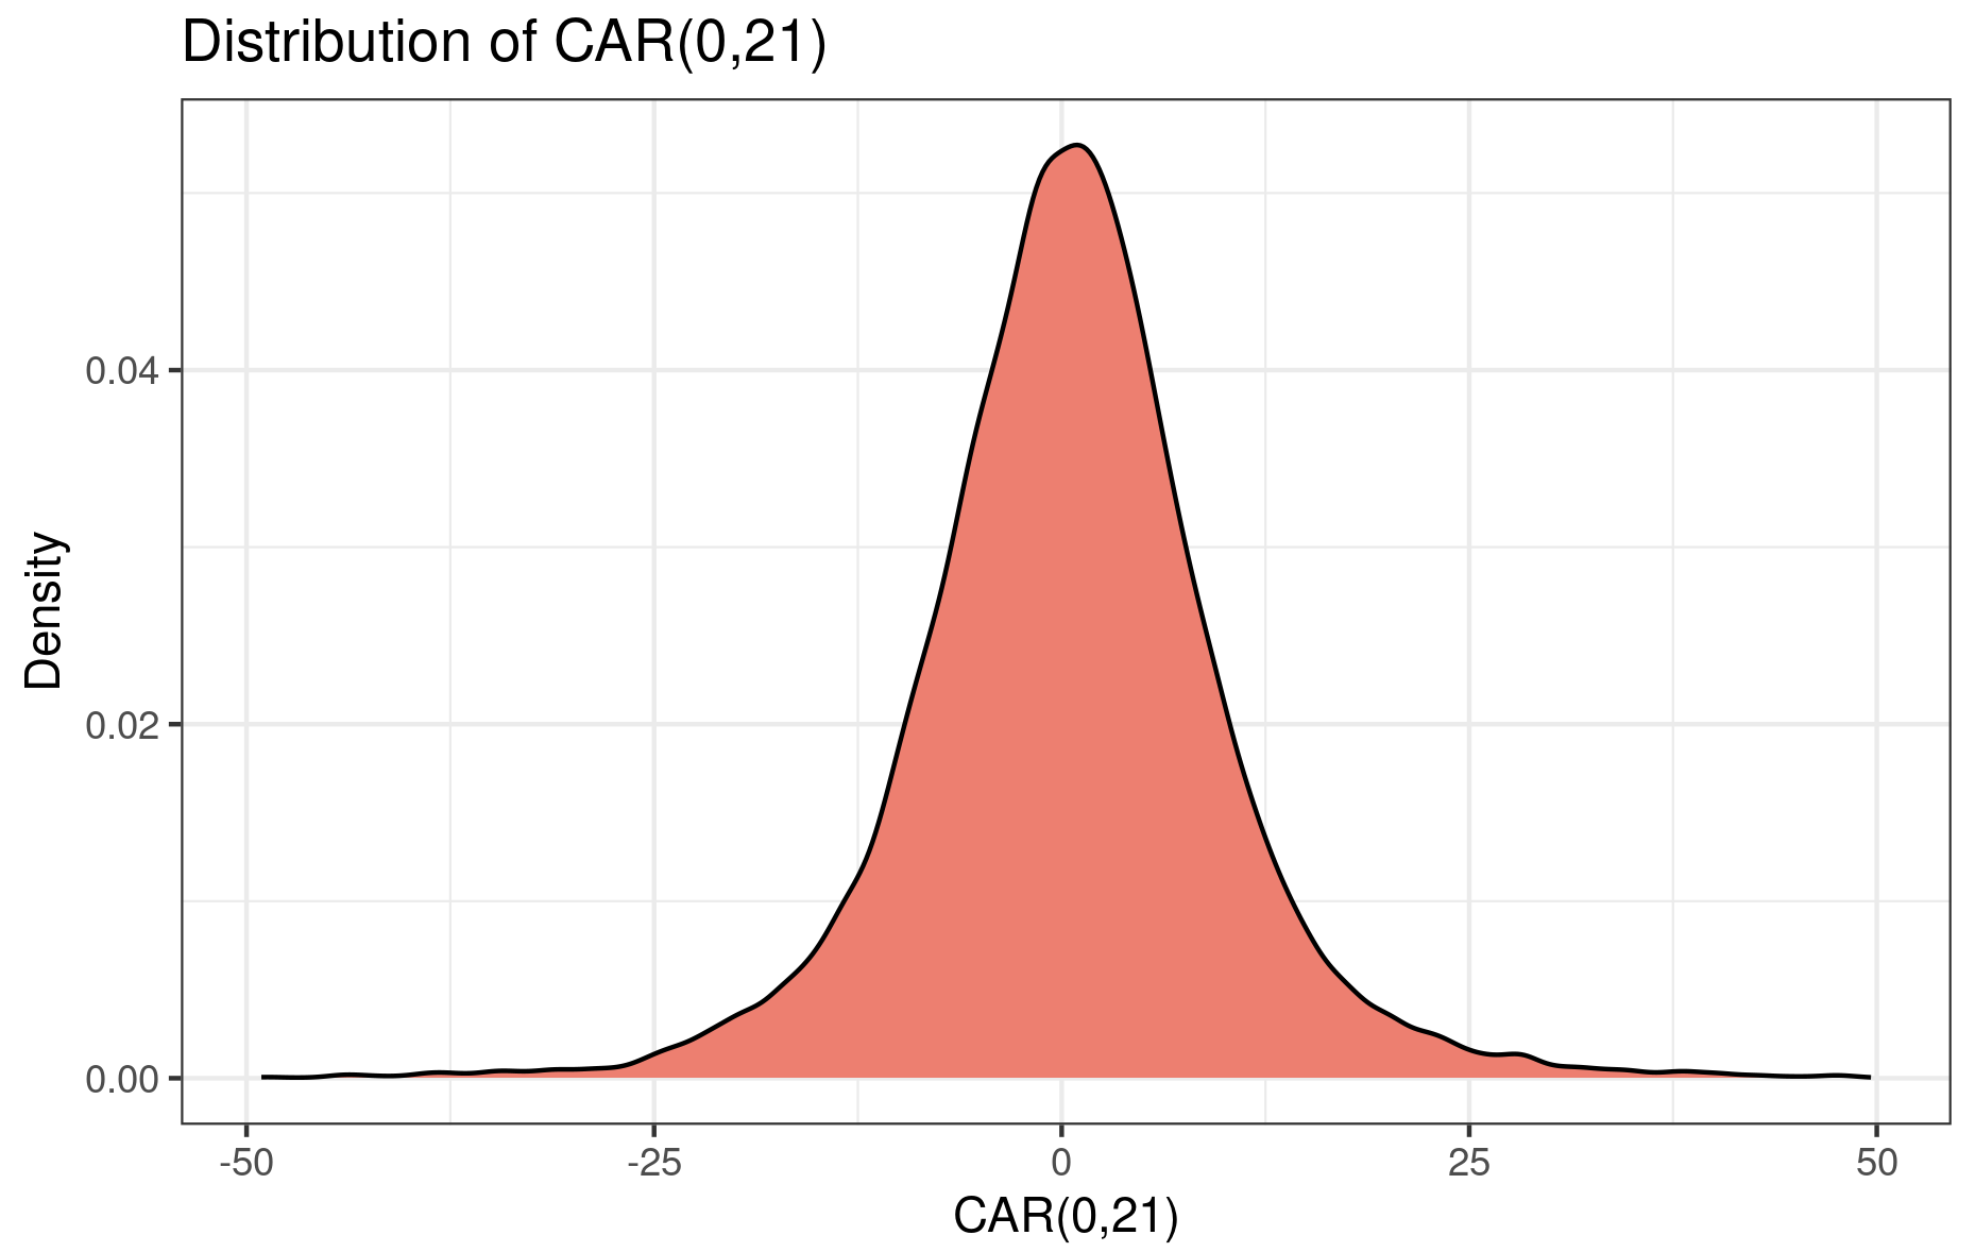
Given the four prediction models, we’re particularly interested in the model performance across different quantiles of CAR(0,21). This is meaningful in practice. As shown in the figure below, most CAR(0,21) values are centered around zero. However, we’re often more interested in the tails because they represent large (positive or negative) price drift, and most trading strategies profit when there’s a big price movement.
In our test, we train the four CAR(0,21) prediction models on the full dataset. Then we evaluate model performance on different quantiles of CAR(0,21). For example, we can ask the model to predict the top 10% and bottom 10% of CAR(0,21) (that’s 20% of the full sample), and calculate performance. Then we extend this to the top 20% and bottom 20%, and calculate performance again.
3 Results
The results are shown in the following figure.
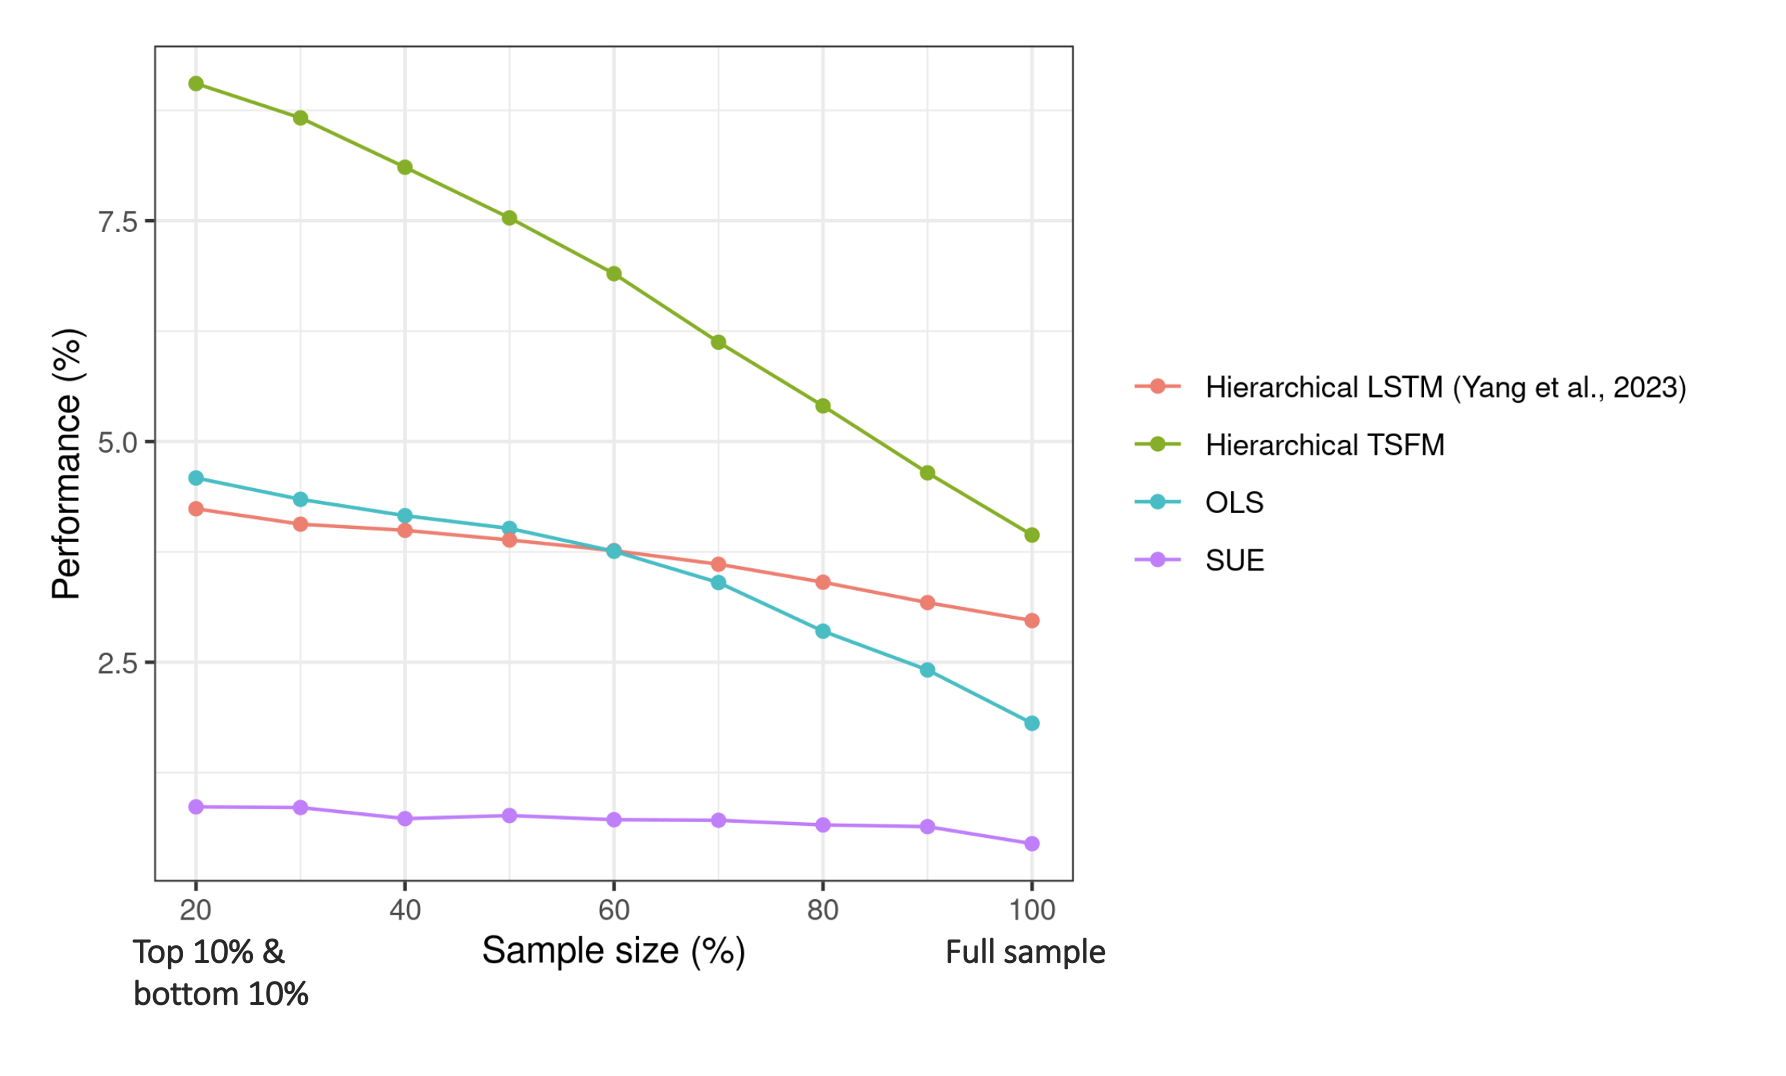
The y-axis shows model performance (measured by $R^2$; higher is better). The x-axis shows the sample size on which the model is evaluated. “20” means we predict the top and bottom 10% CAR(0,21), i.e., the tails of the distribution. “100” means we predict the full sample (i.e., top and bottom 50%). As the x-axis moves from left to right, the sample size becomes larger and less extreme. Two observations stand out:
- First, deep learning models (LSTM and Transformer) significantly outperform OLS and SUE, and Transformer is better than LSTM.
- Second, and perhaps more interesting, the Transformer is especially good at predicting extreme data points. For example, when we ask the four models to predict the full sample, the performance lead of Transformer against SUE is about 3.5% (3.94%–0.44%). However, if we only predict the top and bottom 10% of CAR(0,21), Transformer’s performance lead jumps to 8.19% (9.05%–0.86%).
Without further investigation, this is my guess:
- When companies have a large (either positive or negative) PEAD, it means something special is taking place. Compared with normal times (when companies have small PEADs), this special development ultimately leaves linguistic “marks”—perhaps a particular vocabulary, perhaps a particular way of speaking (e.g., more passive verbs, more third-person perspective). These are captured by the Transformer.
- LSTM is also a deep neural network, but it’s non‑contextual, meaning the representation of a word is fixed. This severely restricts its power.
4 References
- Vaswani, A., Shazeer, N., Parmar, N., Uszkoreit, J., Jones, L., Gomez, A. N., Kaiser, Ł., & Polosukhin, I. (2017). Attention is all you need. 5998–6008.
- Yang, L., Ng, T. L. J., Smyth, B., & Dong, R. (2020). Html: Hierarchical transformer-based multi-task learning for volatility prediction. Proceedings of The Web Conference 2020, 441–451.
- Yang, Y., Qin, Y., Fan, Y., & Zhang, Z. (2023). Unlocking the Power of Voice for Financial Risk Prediction: A Theory-Driven Deep Learning Design Approach. Management Information Systems Quarterly, 47(1), 63–96.
- Meursault, V., Liang, P. J., Routledge, B. R., & Scanlon, M. M. (2021). PEAD.txt: Post-Earnings-Announcement Drift Using Text. Journal of Financial and Quantitative Analysis, 1–50.