A Short Introduction to Investor Networks
1 What’s an Investor network (Investor Network)?
An Investor network is a graph (N,E) where N (node) and E (edge) represent investors and the connections between them. Investor Networks are very helpful in modeling peer influence between investors.
“Why bother building a network? Many studies on peer influence do not require building any network,” you may ask. For example, in (Kaustia & Knüpfer, 2012), the dependent variable is an individual’s stock market entry decision, and the main explanatory variable is the average return of peers from the same zip code. Since the author assume investors from the same zip code share the same peer influence, no graph is needed. So why we want to build a graph?
Building a Investor Network (graph) offers several merits:
Researchers can leverage numerous well-established network statistics (e.g., degree, centrality). These statistics can provide more information than a simple average of neighborhood level.
Peer influence and be measured both locally and globally. Statistics like degree or cluster size measure an investor’s neighborhood, while statistics centrality measure an investor’s global position in the network.
It allows for simulating the propagation of certain behavior through the network. For example, with an explicit network, we can simulate how active trading (Han et al., 2018) propagates from active traders to non-active traders.
2 Types of Investor Network
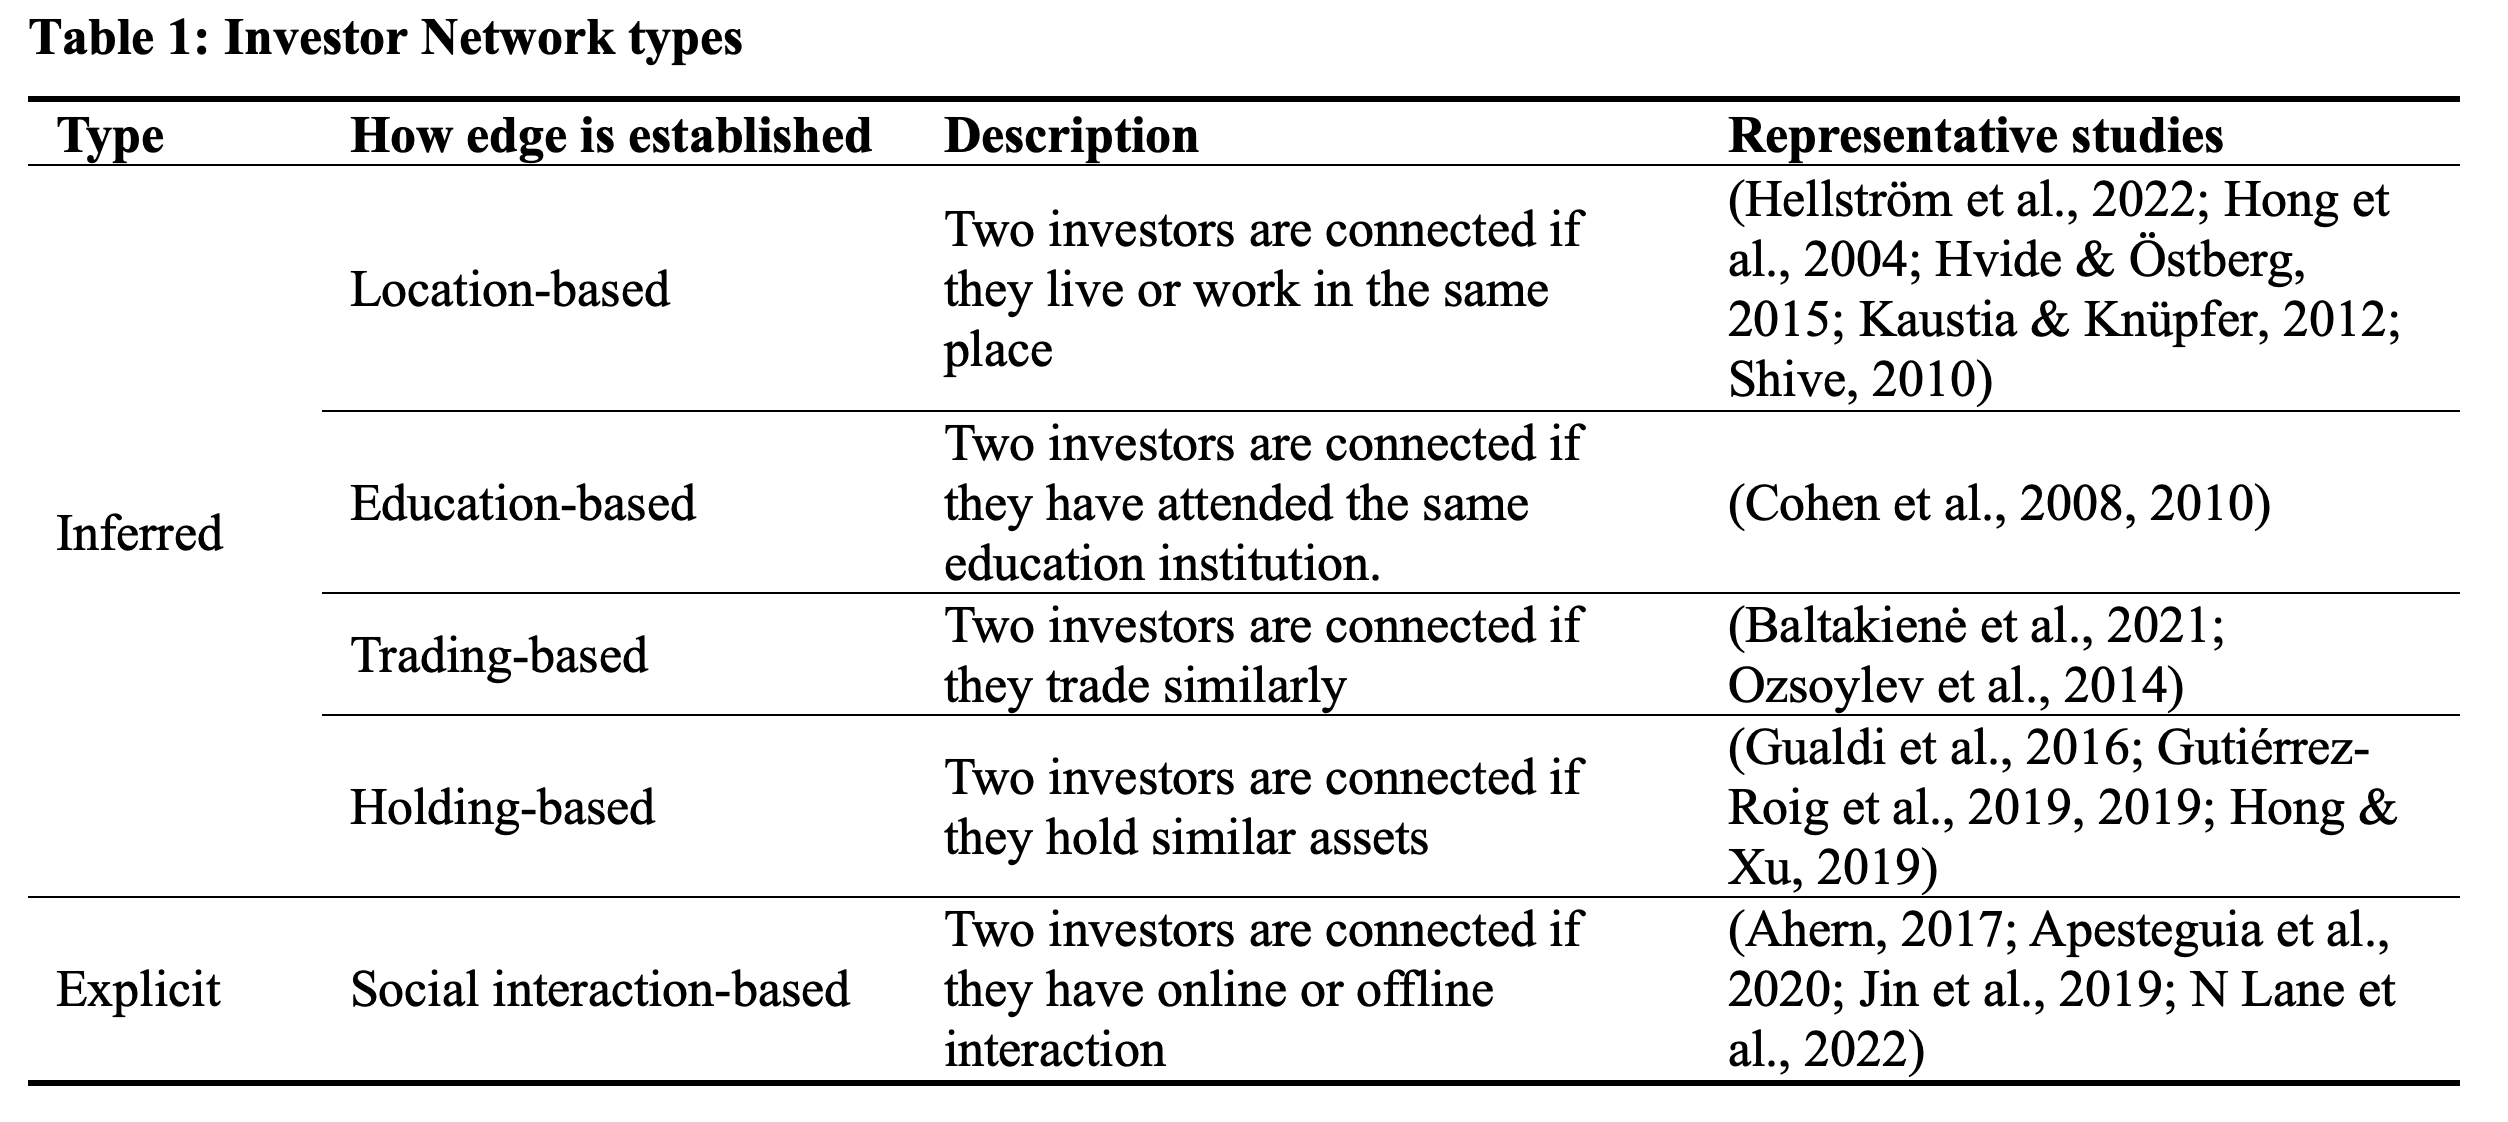
Investor Network can be classified into two groups: inferred and explicit. We say an Investor Network is inferred if the edge between two investors is established based on some mutual attributes. For example, in (Ozsoylev et al., 2014), two investors are consider connected if they trade the same stock in the same direction for three times in 30 minutes. Such inference surely introduces false positives. What’s captured may be homophily (investors act alike because they share similar backgrounds, not because they share information) instead of social interaction (Ahern, 2017). But inferred networks can be a good approximation if researchers have no access to investors’ real world social relationships. We further identified four subgroups based on the type of the mutual attributes: location-based, education-based, trading-based, and holding-based (Table 1).
In contrast, explicit Investor Networks are based on real investor interaction. For example, the following activity on social networks (Apesteguia et al., 2020) or instant messgae communication (N Lane et al., 2022). While the data is much more difficult to obtain compared with explicit Investor Networks, the results can be more credible to some extent. Table 1 summarizes the Investor Networks mentioned above.
2.1 Explicit Investor Networks
2.1.1 Location-based
Two investors are connect if they live or work in the same place.
(Caution!) If we create a location-based network based on coarse location identifiers (e.g., zip code), there will be many isolated communities. That is, only investors from the same area are connected. This will harm the calculation of centrality and other network statistics.
Representative studies
Fund mangers’ decision is influenced by their peers from the same city. (Hong et al., 2005)
Neighbors’ high performance boost the stock market participation. (Kaustia & Knüpfer, 2012)
Stock market participation is also correlated with those of coworkers. (Hvide & Östberg, 2015)
The overlap of funds whose managers reside in the same neighborhood is considerably higher than that of funds whose managers live in the same city but in different neighborhoods (Pool et al., 2015).
2.1.2 Education-based
- Two investors are connected if they attended the same education institution
Representative studies
“We focus on connections between mutual fund managers and corporate board members via shared education networks. We find that portfolio managers place larger bets on firms they are connected to through their network, and perform significantly better on these holdings.” (Cohen et al., 2008)
Fund manager $i$ is connect to firm $s$ if any of the senior officers (CEO, CFO, Chairman) $j$ has also attended the same education institution.
Harvard is connected to 12% of US public firms and 16% US mutual funds.
Similarly, (Cohen et al., 2010) investigated sell-side analysts and senior officers via shared an educational link. They found analysts outperform in the firms which they have an educational link.
2.1.3 Trading-based
- Two investors are connected if they trade similarly
Representative studies
Two investors trade same stock within the same time window $\Delta T$ at least $M$ time. (Ozsoylev et al., 2014)
$\Delta=30$ (min)
$M=3$
The authors also try $\Delta t$ of 1 min, 5 min, 15 min, 30 min. $M$ remains to be 3.
The above method has a major flaw: It doesn’t exclude the impact from public information. Two investors with no social interaction may still trade similarly if their decisions are based on the same public information. To mitigate the problem, (Baltakienė et al., 2021) subtracts a benchmark trading volume from the actual trading volume, and estimate the Investor Network only using the remaining abnormal part. The benchmark trading volume represents how much an investor would trade if she only follows public information. In the paper, the author estimate the benchmark trading volume using a linear regression, but it can be easily extend to more complex non-linear models.
Another way to improve (Ozsoylev et al., 2014) is to remove “statistically insignificant edges”, proposed by (Tumminello et al., 2011) and is applied in many studies such as (Han et al., 2019). The idea is that edges established through trading synchronization many contain many false positives. These paper apply a threshold to only keep edges that are statistically significant.
2.1.4 Holding-based
- Two investors are connected if their holdings (positions) are similar.
Representative studies
The Investor Network is a bipartite network of stocks and investors. The link is determined by the strength of holding overlaps. (Gualdi et al., 2016)
The edges are established by computing the mutual information and transfer of entropy of two investors’ position time series. (Gutiérrez-Roig et al., 2019)
(low priority, very complicated) The Investor Network is estimated by solving a complicated investment optimization problem (Hong & Xu, 2019)
When we use trading- or holding-based methods to construct Investor Networks, a common challenge is that the resulting network may contain false positive edges. That is, two investors happens to trade similarly (maybe they’re applying similar strategy) without actually know each other.
Several methods are developed to filter out these false positive edges. One popular is SVN (statistically validated network) by (Tumminello et al., 2011). Others include MTC correction (Gutiérrez-Roig et al., 2019), Bipartite Confguration Model (BiCM) (Gualdi et al., 2016), correlation filtering (Aste and Di Matteo, 2006), Minimum Spanning Tree (MST) (Gower and Ross, 1969; Mantegna and Stanley, 1999; Mantegna, 1999), richer network structure preserving algorithm – Planar Maximally Filtered Graph (PMFG) (Tumminello, Aste et al., 2005). Furthermore, probabilistic topological regularization approach for network fltering is introduced in Aste (2022). Alternatively, Granger causality network fltering technique is discussed in (Billio et al., 2012).
2.2 Explicit Investor Network
- Instead of inferring from education or trading history, we can directly get one’s network by looking at his phone contact, social network friends, etc.
Representative studies
From social trading platform such as eToro or ZuluTrade. On a social trading platform, users can “subscribe” or “copy” other’s trading. (Apesteguia et al., 2020)
Instant messages between professional day-traders. (N Lane et al., 2022)
Sometimes legal files about insider trading also reveal the information network. (Ahern, 2017)
3 What statistics can we derive from an Investor Network (the “X”)?
Neighbors’ value
- e.g., neighbor’s return, neighbor’s risk taking, etc.
Network-based statistics
Degrees
Centrality (Ozsoylev et al., 2014)
cluster size
betweenness
…
4 What Investment Outcomes can we test (the “Y”)?
The stability of Investor Network
- Divide the Investor Network into same-length period and investigate the overlap of links (Section 3.1 of (Ozsoylev et al., 2014))
Investment participation
- Many studies show that stock market participation is associated with neighbor’s performance, e.g., (Kaustia & Knüpfer, 2012)
Risk taking
- Risk taking is affected by peers, and the effect is stronger for less wealthy, for those with relatively higher disposable incomes, and for male investors, respectively. (Hellström et al., 2022)
Investment return
- Higher centrality -> higher return
Trade timing
Higher centrality -> trade earlier than neighbors?
Higher centrality -> trade earlier w.r.t. real information events?
See Section 3.2 of (Ozsoylev et al., 2014)
Geographical proximity -> synchronization in trade timing (Baltakys et al., 2019).
(low priority) The validity of estimated Investor Network
- In (Hong & Xu, 2019), the estimated Investor Network can be used to infer the geological locations of investors. We can test whether the inferred location is the same as the actual investor location.
(hypothetical) Identify investor clusters
- Some papers identify investor clusters and investigate the evolution of the clusters over the years. However, the empirical tests in these papers are more from a network science perspective, and hence very limited economic conclusion can be drawn. (Musciotto et al., 2018)
(hypothetical) Understand private information flow in the network
Predict future tradings
- All the above is explanatory. We can use the inferred Investor Network to predict investors’ future trading behavior (Baltakys et al., 2022).
5 Other interesting papers
How to better infer a monopartite network from a bipartite network (Baltakys, 2023).
(Baltakys et al., 2018) proposed a multilayer aggregation method for network inference, i.e., they first build stock-wise and time-wise networks and then aggregate them on stock and time level.
6 Reference
- Ahern, K. R. (2017). Information networks: Evidence from illegal insider trading tips. Journal of Financial Economics, 125(1), 26–47. https://doi.org/10.1016/j.jfineco.2017.03.009
- Apesteguia, J., Oechssler, J., & Weidenholzer, S. (2020). Copy trading. Management Science, 66(12), 5608–5622.
- Baltakys, K. (2023). Inference of monopartite networks from bipartite systems with different link types. Scientific Reports, 13(1), Article 1. https://doi.org/10.1038/s41598-023-27744-8
- Baltakienė, M., Kanniainen, J., & Baltakys, K. (2021). Identification of information networks in stock markets. Journal of Economic Dynamics and Control, 131, 104217.
- Baltakys, K., Kanniainen, J., & Emmert-Streib, F. (2018). Multilayer Aggregation with Statistical Validation: Application to Investor Networks. Scientific Reports, 8(1), Article 1. https://doi.org/10.1038/s41598-018-26575-2
- Baltakys, K., Baltakienė, M., Kärkkäinen, H., & Kanniainen, J. (2019). Neighbors matter: Geographical distance and trade timing in the stock market. Finance Research Letters, 31. https://doi.org/10.1016/j.frl.2018.11.013
- Baltakys, K., Baltakienė, M., Heidari, N., Iosifidis, A., & Kanniainen, J. (2022). Predicting the Trading Behavior of Socially Connected Investors: Graph Neural Network Approach with Implications to Market Surveillance (SSRN Scholarly Paper No. 4163635). https://doi.org/10.2139/ssrn.4163635
- Cohen, L., Frazzini, A., & Malloy, C. (2008). The small world of investing: Board connections and mutual fund returns. Journal of Political Economy, 116(5), 951–979.
- Cohen, L., Frazzini, A., & Malloy, C. (2010). Sell-side school ties. The Journal of Finance, 65(4), 1409–1437.
- Gualdi, S., Cimini, G., Primicerio, K., Di Clemente, R., & Challet, D. (2016). Statistically validated network of portfolio overlaps and systemic risk. Scientific Reports, 6(1), Article 1. https://doi.org/10.1038/srep39467
- Gutiérrez-Roig, M., Borge-Holthoefer, J., Arenas, A., & Perelló, J. (2019). Mapping individual behavior in financial markets: Synchronization and anticipation. EPJ Data Science, 8(1), 10. https://doi.org/10.1140/epjds/s13688-019-0188-6
- Han, R.-Q., Li, M.-X., Chen, W., Zhou, W.-X., & Stanley, H. E. (2019). Structural properties of statistically validated empirical information networks. Physica A: Statistical Mechanics and Its Applications, 523, 747–756. https://doi.org/10.1016/j.physa.2019.03.010
- Hellström, J., Stålnacke, O., & Olsson, R. (2022). Individuals’ financial risk-taking and peer influence. The Quarterly Review of Economics and Finance.
- Hong, H., Kubik, J. D., & Stein, J. C. (2005). Thy neighbor’s portfolio: Word-of-mouth effects in the holdings and trades of money managers. The Journal of Finance, 60(6), 2801–2824.
- Hong, H., & Xu, J. (2019). Inferring latent social networks from stock holdings. Journal of Financial Economics, 131(2), 323–344. https://doi.org/10.1016/j.jfineco.2017.08.005
- Hvide, H. K., & Östberg, P. (2015). Social interaction at work. Journal of Financial Economics, 117(3), 628–652. https://doi.org/10.1016/j.jfineco.2015.06.004
- Kaustia, M., & Knüpfer, S. (2012). Peer performance and stock market entry. Journal of Financial Economics, 104(2), 321–338.
- Musciotto, F., Marotta, L., Piilo, J., & Mantegna, R. N. (2018). Long-term ecology of investors in a financial market. Palgrave Communications, 4(1), Article 1. https://doi.org/10.1057/s41599-018-0145-1
- N Lane, J., Lim, S. S., & Uzzi, B. (2022). Biased information transmission in investor social networks: Evidence from professional traders. Sonya S. and Uzzi, Brian, Biased Information Transmission in Investor Social Networks: Evidence From Professional Traders (October 30, 2022).
- Ozsoylev, H. N., Walden, J., Yavuz, M. D., & Bildik, R. (2014). Investor networks in the stock market. The Review of Financial Studies, 27(5), 1323–1366.
- Pool, V. K., Stoffman, N., & Yonker, S. E. (2015). The People in Your Neighborhood: Social Interactions and Mutual Fund Portfolios. The Journal of Finance, 70(6), 2679–2732. https://doi.org/10.1111/jofi.12208
- Tumminello, M., Miccichè, S., Lillo, F., Piilo, J., & Mantegna, R. N. (2011). Statistically Validated Networks in Bipartite Complex Systems. PLOS ONE, 6(3), e17994. https://doi.org/10.1371/journal.pone.0017994